
AWS finally supports Lambda remote debugging — something developers have been waiting for for years. This is similar to my Lambda Live Debugger. This is great news for developers and also for the Lambda Live Debugger project. It will help make this approach more popular, as more developers will see that this is by far the most productive way of developing serverless applications. And since Lambda Live Debugger has several key advantages, this also means great news for the project.
How does Lambda Live Debugger compare with the new official remote debugging? LLD integrates with your frameworks, debug multiple Lambdas at once, support TypeScript, no code reupload after a change...Share on LinkedIn
Here is a comparison between the two solutions:
Architecture
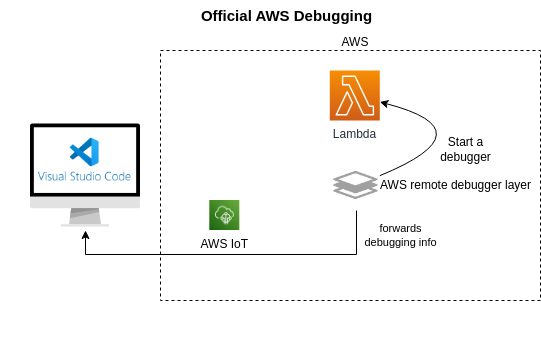
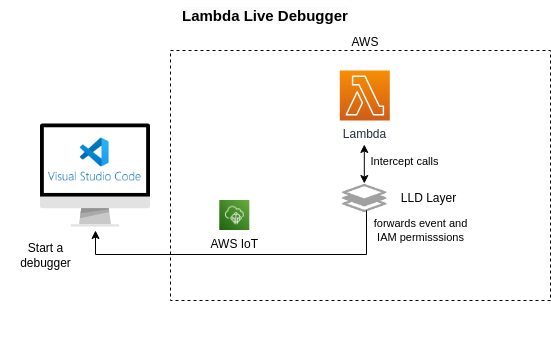
Both solutions work by attaching a layer to the Lambda function. The official AWS solution removes the layer immediately after the Lambda is invoked. Lambda Live Debugger leaves the layer attached until you decide to remove it. Both solutions use AWS IoT to communicate with your computer.
The official AWS solution runs a debugger on the Lambda itself and then connects to your VS Code. That means with the official AWS debugger, when you change code, you must upload it to the cloud to debug.
In contrast, Lambda Live Debugger sends the event alongside IAM permissions to your computer, and the debugger runs locally. Since the code runs on your machine, you don’t need to upload anything. Reloading and, if needed, transpiling/compiling TypeScript to JavaScript happens automatically and instantly.
However, there’s one important benefit to how the official AWS debugger works: since the debugger is running in Lambda, it has access to resources inside a VPC, which Lambda Live Debugger cannot access.
Supported Languages
Official AWS Lambda remote debugging supports JavaScript, Python, and Java. JavaScript source maps are not supported, which makes debugging TypeScript impossible. If I understood correctly, support is on the way. Because source maps are not supported, it would be extremely difficult/impossible to debug code that was bundled and minified.
Lambda Live Debugger only supports JavaScript and TypeScript. TypeScript support with automatic transpiling/compiling is a key feature.
Lambda Handler Source Code
Official AWS Lambda debugging requires you to point to your local code or download it from the cloud. The debugger just steps through that code; actual execution still happens in the cloud. You can’t point to your TypeScript code — only to the transpiled version. That’s very hard to do if you’re using AWS CDK, because the assets are in random folders under cdk.out.
Lambda Live Debugger does not require this. It can read your framework configuration and automatically find the source code.
Supported Frameworks
The official AWS Lambda debugging does not support any framework. Linking a Lambda to the source code requires manual clicking. That’s why the solution is deeply integrated into VS Code.
Lambda Live Debugger supports all popular frameworks (CDK, Serverless Framework, SAM, Terraform, OpenTofu). This was most challenging for me when building the tool. It was especially difficult to support CDK. The tool automatically finds the Lambda's source code. You just need to enter a few key parameters when configuring the project.
Lambda Live Debugger also works if you have your own unique setup — just list your Lambdas.
Supported IDE
The official AWS debugger is integrated with VS Code via the AWS Toolkit extension. No other IDEs are supported.
Lambda Live Debugger doesn’t depend on a specific IDE — because the debugger runs on your local machine, any tool that supports JavaScript debugging works. But the tool generates debugging configuration for VS Code and JetBrains IDEs like WebStorm, so the debugging is seamless, with just starting the debugger.
Capturing Events
Official AWS Lambda remote debugging intercepts only events invoked from VS Code. That makes it impossible to intercept live events that occur in the system. You need to prepare your own sample payload. You can debug only one Lambda at a time. This makes it impossible to debug a system as a whole. I do not know why they decided to do that.
Lambda Live Debugger can debug multiple Lambdas and can capture real events that happen in the system.
Developer experience
I must say the developer experience with the official AWS solution feels clumsy. First, you need to find your Lambda in the list of all Lambdas you have in your account in your region. Then you need to link it to the source code. You need to write a sample payload, and then you can invoke the function. You need to do that for every function. If you change your code, you need to upload the new version. The VS Code extension asks you to do that for you. But the process is slow, and you always have to disconnect and reconnect the debugger to get the new version.
With Lambda Live Debugger, you just run the wizard once, where you mostly confirm the default settings. Then you start the debugger. No need to enter a sample payload, no need to reupload the code.
Summary of Benefits
Official AWS Remote Debugging:
- Can access private VPC resources.
- Supports Python and Java in addition to JavaScript.
Lambda Live Debugger:
- Support TypeScript with automatic transpiling/compiling.
- No uploads are needed when code changes.
- Debug multiple Lambdas at once.
- Captures real events happening in your system, not just sample events you write yourself.
- Supports all popular frameworks (CDK, Serverless Framework, SAM, Terraform, OpenTofu)
- Automatic configuration for VS Code and JetBrains IDEs. Works with any IDE that supports JavaScript debugging.
- Automatically finds Lambda source code.
- Fast, seamless developer experience integrated with your framework of choice.
Final Thoughts
It’s exciting to see AWS embrace remote debugging — it validates how powerful this approach is for serverless development. However, while the official solution lays important groundwork, it currently comes with significant limitations, especially for TypeScript developers and real-world debugging scenarios.
Lambda Live Debugger remains the most flexible, developer-friendly, and efficient option for debugging JavaScript and TypeScript Lambdas. It’s ideal for working with modern frameworks, real traffic, and complex serverless systems.
The official AWS Remote Debugging is the go-to choice if you're working with Python or Java, or if you need to access resources inside a private VPC.
As the ecosystem evolves, having both tools available is a win for developers. Choose the one that fits your workflow — or use both where they shine.