
This is continuation of a blog about common mistakes when building serverless systems on AWS. It is split into the following parts:
- Coding
- Architecture
- Performance, scalability, optimization, and monitoring
- Costs
- Communication with other systems
- Security
- Unexpected Behaviors (here)
When developing serverless solutions, we integrate a lot of services from our providers. Unfortunately, as with everything in life, these services sometimes have their peculiarities that we have to live with. These are not a problem as long as we are aware of them.
CloudFront Cache Errors
CloudFront cache errors (HTTP 4xx or 5xx status codes) by default for 5 minutes. That means if you have an occasional error or bug in a software then it will be cached and you will bash your head against the wall until the 5 minutes are over and the thing "randomly" begins to work. Go to CloudFront Error Pages, create custom error response, chose the appropriate HTTP error code, and set the error caching minimum TTL to 0. Read more about this here.
CloudFront cache errors (HTTP 4xx or 5xx status codes). Bash your head against the wall until the 5 minutes are over and the thing "randomly" begins to work.Share on LinkedIn
DynamoDB Empty String
An attribute value cannot be an empty string. Saving this will fail with the error: One or more parameter values were invalid: An AttributeValue may not contain an empty string
{
   id: 123,
   value: ""
}
An attribute value cannot be an empty string in #DynamoDBShare on LinkedIn
You can solve this with the helper function that you call before saving data to DynamoDB, that traverse object tree. Check if value is an empty string and remove property in that case.
You can use this helper written in TypeScript:
export class DynamoDBUtil {
  removeEmptyStrings(data: any) {
    this.removeEmptyStringsRecursive(data, []);
  }

  private removeEmptyStringsRecursive(data: any, processedObjects: Array<any>) {
    if (processedObjects.includes(processedObjects)) {
      return;
    }
    processedObjects.push(data);

    for (var name in data) {
      let value = data[name];
      if (value === '') {
        delete data[name];
      } else if (typeof value === 'object') {
        this.removeEmptyStringsRecursive(data[name], processedObjects);
      }
    }
  }
}
Cognito Message Templates
Cognito user pools is a great service to manage users. It can cover whole authentication flow such as sign-up, confirmation, password reset, and so on. Users even receive emails for verification/confirmation, which can be customized with a template. Customization is useful if, for example, you do not want to use the AWS default URL for confirmation. Here is the problem: the template for the verification message does not support the placeholder for the username, which is necessary to create such a link, although the other template for invitation message supports the username. The shortcomings can be resolved by the custom Lambda function. But it is a disproportionate action for such a small feature.

AppSync Does Not Detect When Connection Drops
Until the launch of API Gateway WebSockets, AppSync was the preferred way to have a live connection with the client. The problem is that you do not know when the connection drops. Until recently, that was not possible. I analyzed the code of the JavaScript version of SDK and there were actually missing event implementations that signal a connection drop.
Recently, they added a (currently) undocumented feature to subscriptions to be able to listen for control events. It works by adding a special variable to your subscription query. More details can be found here.
#AppSync does not autoreconnect when connection dropsShare on LinkedIn
X-Ray Does Not Support Promises and the Async/Await Pattern in Node.js
X-Ray does not support promise and the async/await pattern. You can still use the latest version of Node.js and the async/await pattern and promises. X-Ray will log all code patterns. But if you want to call the AWSXRay library, you must use callback.
AWSXRay.captureAsyncFunc('my_sub_segment', function(subsegment) { ... })
Also, in this case, you have to use the classic old handler with callback:
handler = (event, context, callback) => { ... }
Of course, you can pack this to promises yourself.
X-Ray Error in Lambda Is Not What You Expect
X-Ray have notion of error and fault. Error is just information that something is not working as expected and fault means that something does not work.
X-Ray: Error is just information that something is not working as expected and fault means that something does not work.Share on LinkedIn
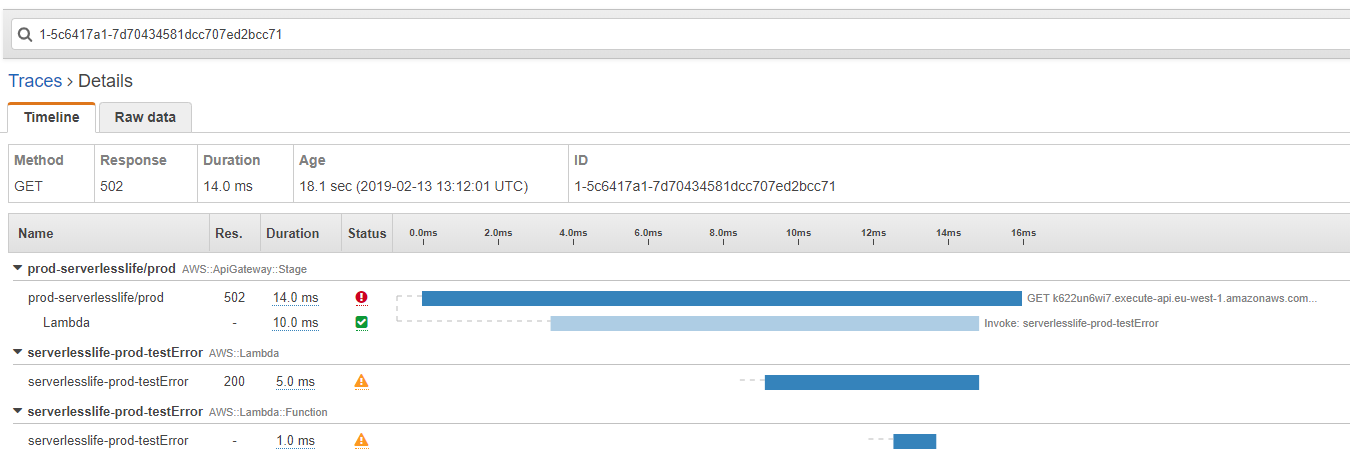
Error does not mean that it does not work
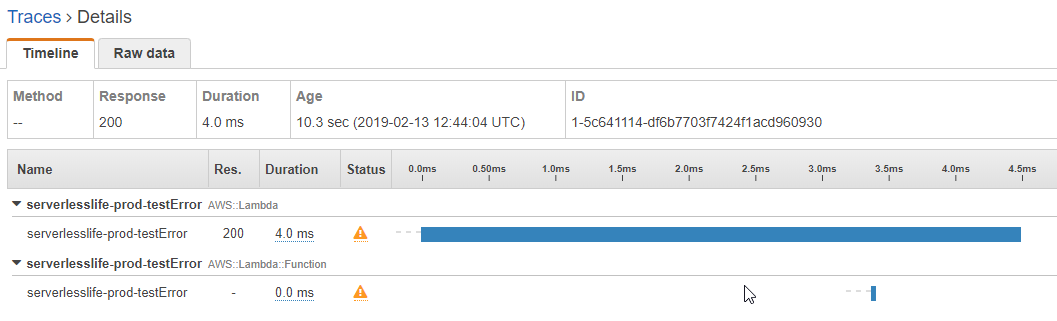
If error/exception is thrown, the Lambda response is 200, which means OK, and trace has the attribute error set to true, but the attribute fault to false.
So, this is what you see:
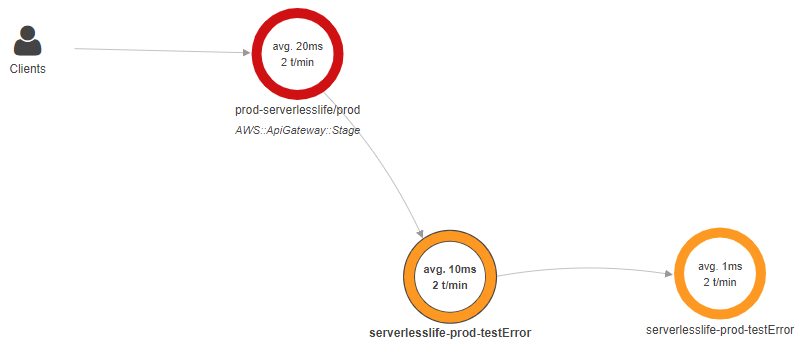
And in the service map:
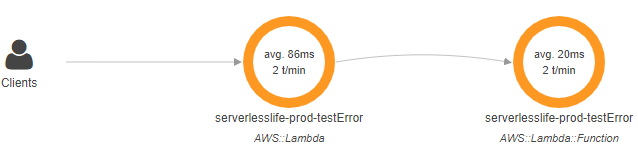
This is clearly not what you would expect. And you cannot fix this, because segment object is fixed. You can not change error and fault property. But you can create a subsegment. Here is a hacky solution.
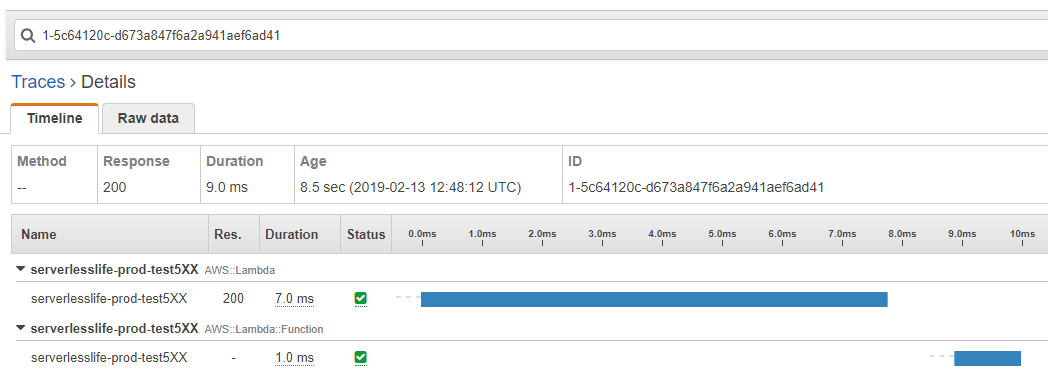
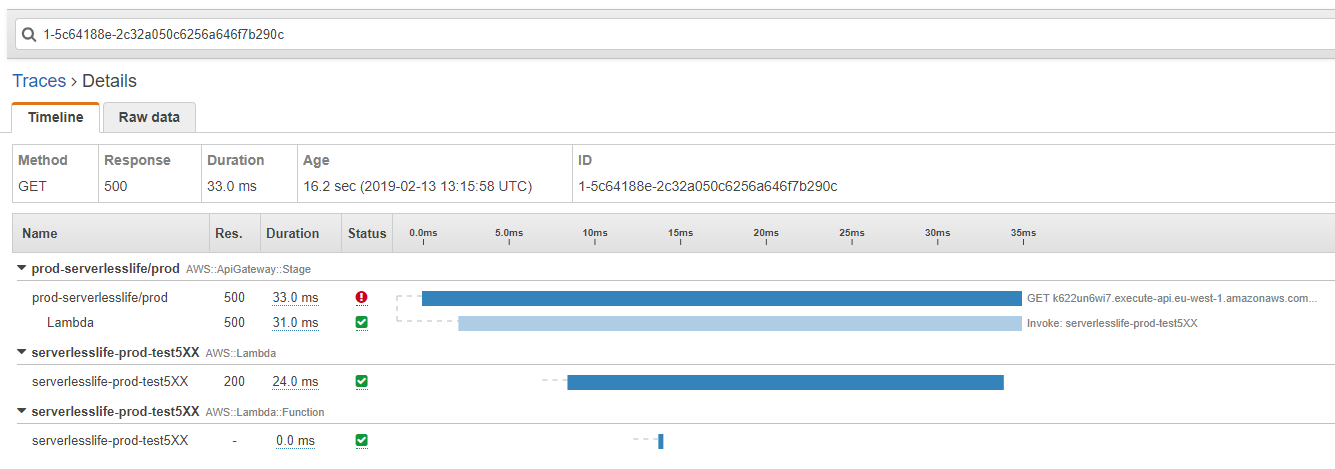
Error code 5XX, but everything looks OK
If you return the HTTP error code 5XX from Lambda, you don't even get that and everything looks like it is working.
Trace:
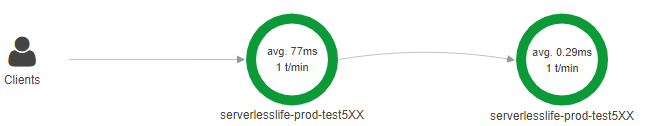
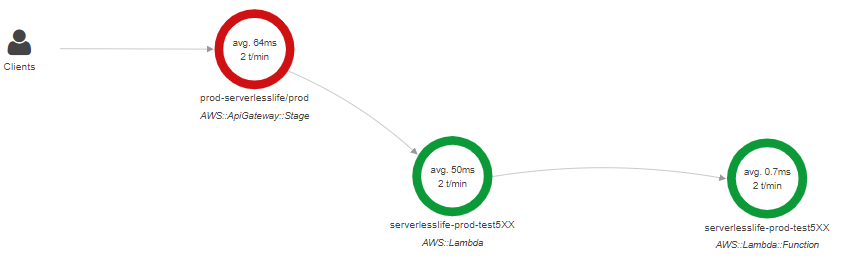
Service map:
API Gateway to the rescue
What you want is fault and a red indication that things are not OK.
If Lambda is called from the API Gateway, you enable trace to get what you want.
In case of throwing error/exception:
If case of a return HTTP error code 5XX:
CloudWatch Custom Metrics Cannot Aggregate by Dimensions
CloudWatch custom metrics is a great tool that allows you to track and visualize any data. It is great not only to track technical parameters but also business parameters such as orders, registration, user actions, and so on. You set alarms on critical metrics that could indicate unanticipated service behavior.
CloudWatch custom metrics also have dimensions that further clarify what the metric is, and what data it stores. But dimensions are not what the name suggests. You cannot aggregate on dimensions like a pivot table. Dimensions are only simple attributes and if you want aggregation by dimensions then you have to send data for each combination of dimensions you want to monitor data.
CloudWatch custom metrics cannot aggregate by dimensionsShare on LinkedIn